Installation and Setup
Tablesaw is an open source Java library for analyzing tabular data, built on top of Java 8 streams. It can be downloaded from GitHub or added as a dependency in Maven or Gradle projects. The latest version at time of writing is 0.38.7.
To add Tablesaw using Maven:
1<dependency>
2  <groupId>tech.tablesaw</groupId>
3  <artifactId>tablesaw-core</artifactId>
4  <version>0.38.7</version>
5</dependency>
For Gradle:
1implementation 'tech.tablesaw:tablesaw-core:0.38.7'
Now we’re ready to start using Tablesaw in our Java code.
Introduction
Tablesaw was created in 2016 by Randall Griffith to provide a simple API for working with tabular data in Java, similar to Pandas in Python. It is maintained by Anthropic and available under the Apache 2.0 license.
The library provides two main structures - Table and Column - for working with tabular data. A Table represents a full dataset with multiple named columns, while Column provides APIs for operating on a single column. Tablesaw uses Java 8 streams under the hood for optimized data processing.
Some key features and capabilities of Tablesaw include:
- Importing data from CSV, databases, Excel, HTML and more
- Filtering, sampling, aggregating, grouping and joining data
- Adding/removing/reordering columns
- Handling missing values
- Performing math, text, date/time and statistical functions
- Creating plots and visualizations
- Exporting data to various formats
Next we’ll go through some hands-on examples to illustrate working with Tablesaw.
Creating Tables
Tables can be created programmatically by adding columns:
1Table table = Table.create("MyTable")
2  .addColumns(
3    Column.create("id", IntColumn.create()),
4    Column.create("name", StringColumn.create()),
5    Column.create("age", IntColumn.create())
6  );
Or they can be imported from external sources like CSV files:
1Table table = Table.read().csv("data.csv");
Columns can be added or removed from an existing table:
1table.addColumns(Column.create("salary", FloatColumn.create()));
2
3table.removeColumns("id");
The order of columns can also be changed:
1table.columnOrder("age", "name", "salary");
Querying and Filtering
Tablesaw provides a SQL-like syntax for querying tables:
1Table results = table.selectWhere(table.intColumn("age").isGreaterThan(30));
This filters for rows where the age column is greater than 30.
We can also group and aggregate data:
1Table summary = table.summarize("age", table.intColumn("age").average()).by("department");
This calculates average age grouped by the “department” column.
Joining and Combining
Tables can be combined both vertically (adding columns) and horizontally (adding rows):
1Table joined = table1.concat(table2); // adds rows
2
3Table wide = table1.join(table2); // adds columns
For key-based joins, Tablesaw supports inner, left outer, right outer and full outer joins:
1Table innerJoin = table1.innerJoin(table2, "id");
2
3Table leftJoin = table1.leftOuterJoin(table2, "id");
Transforming Data
Tablesaw provides many options for transforming column data including:
sortAscending()andsortDescending()map()to apply functionsset()to change valuesremoveMissing()to filter rowsbin()to bucket/discretizelogN()and other math functionslowerCase(),upperCase(),trim()for text
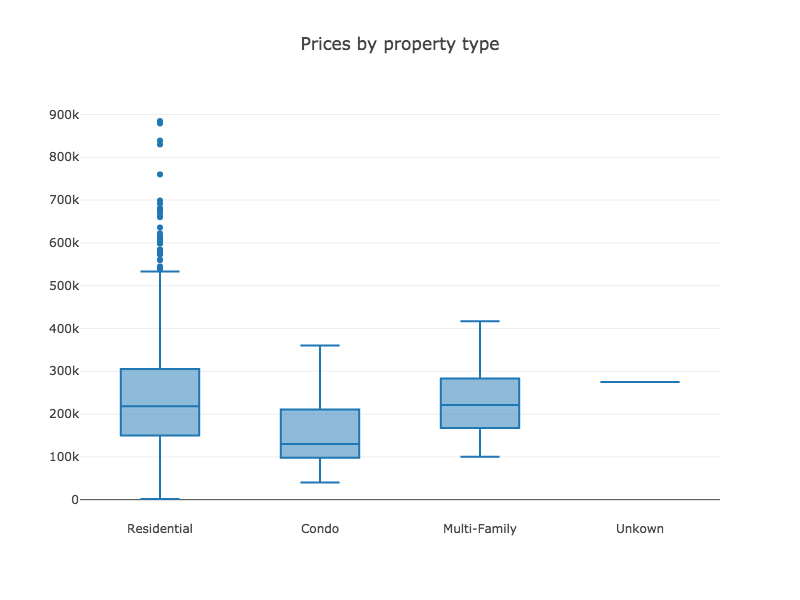
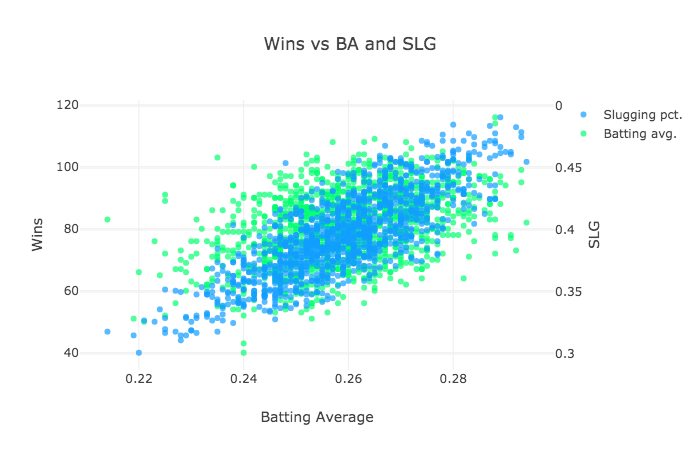
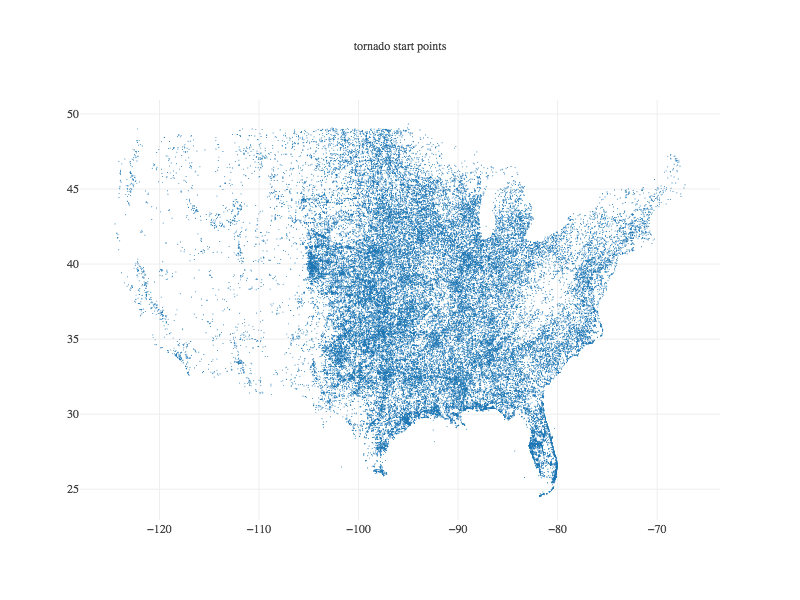
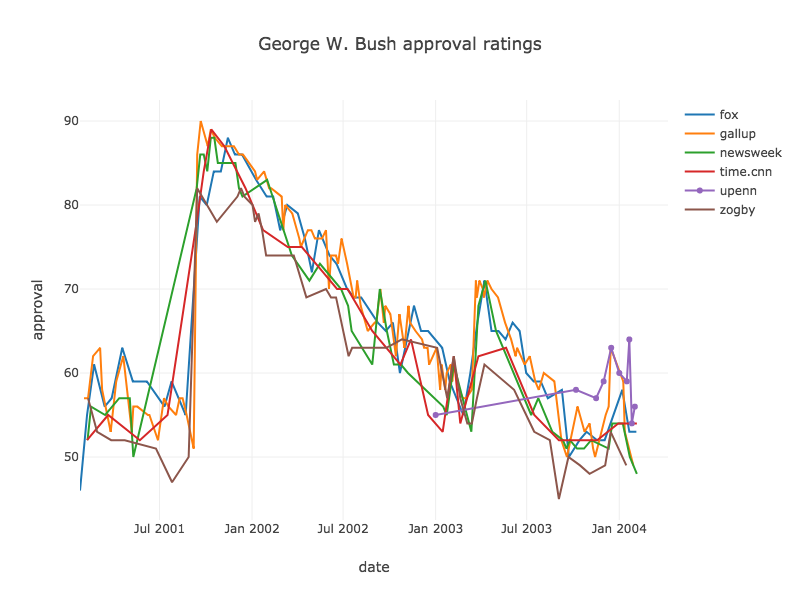
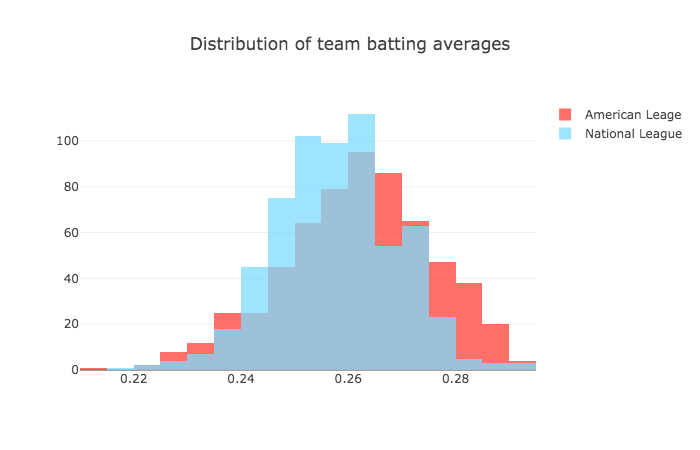
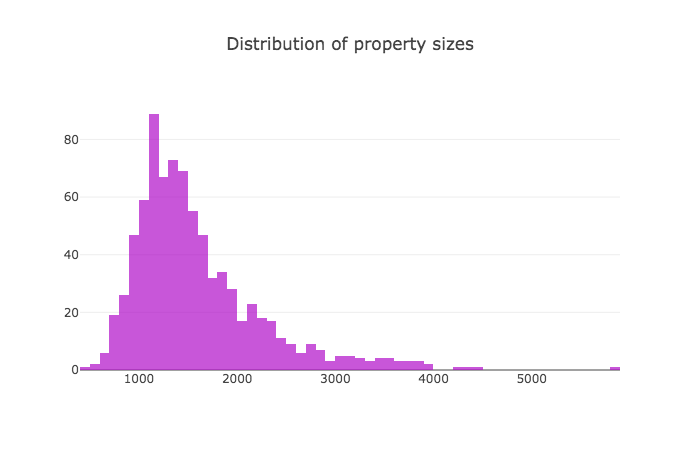
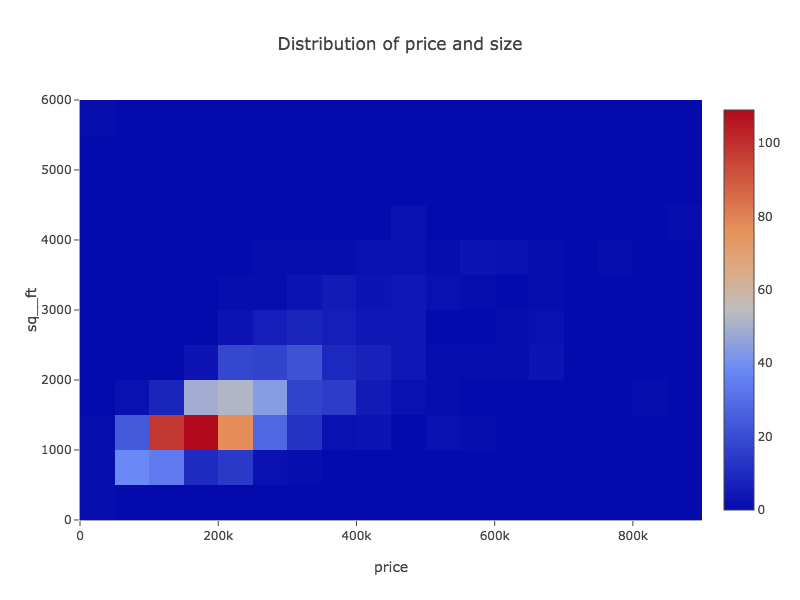
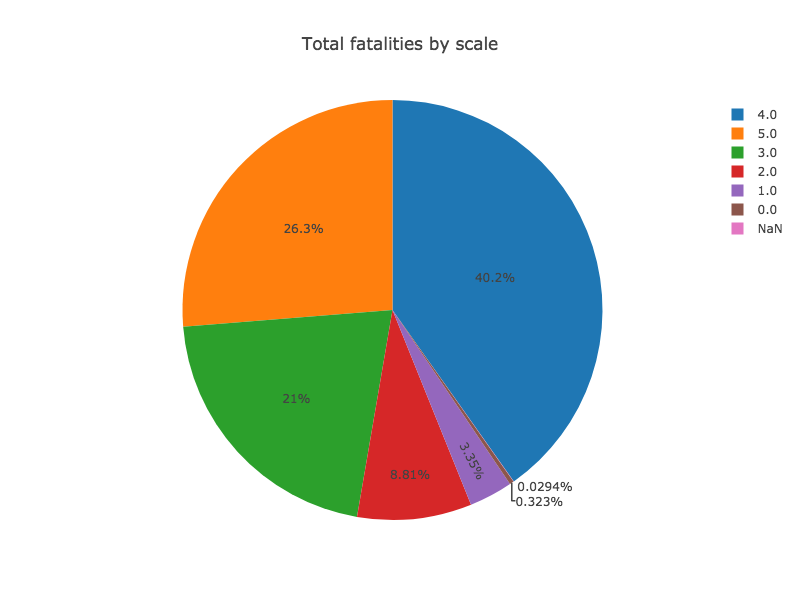
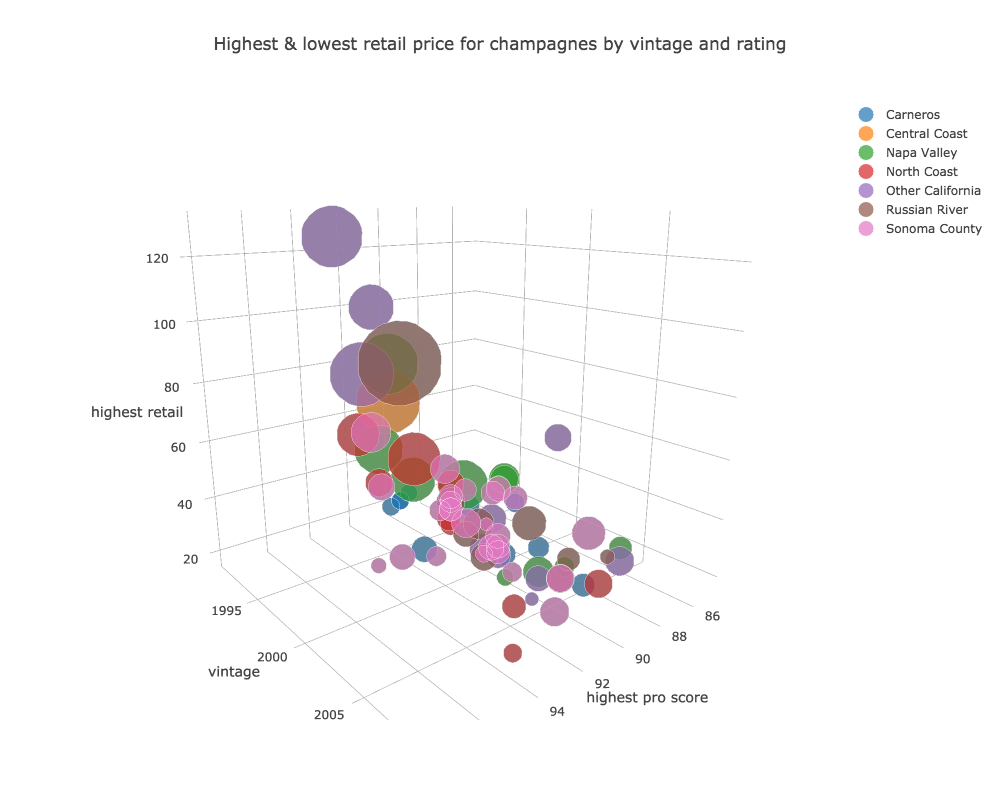
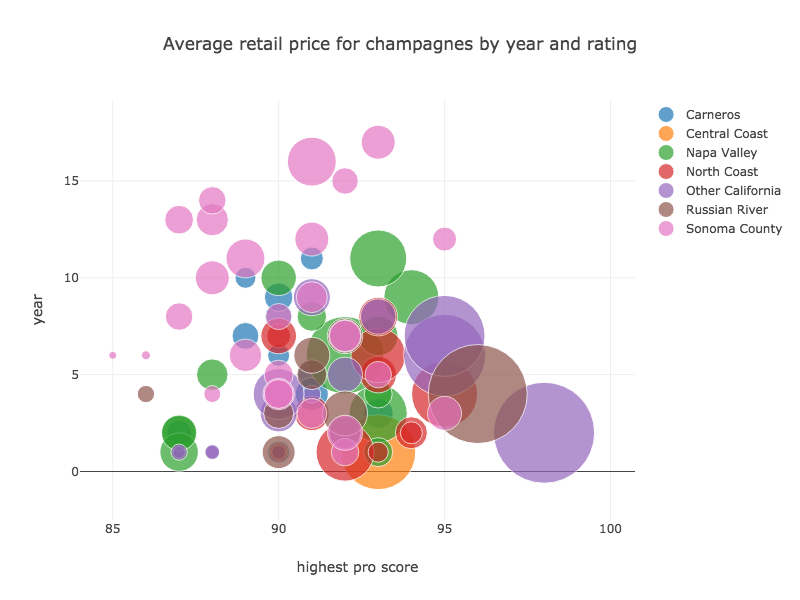
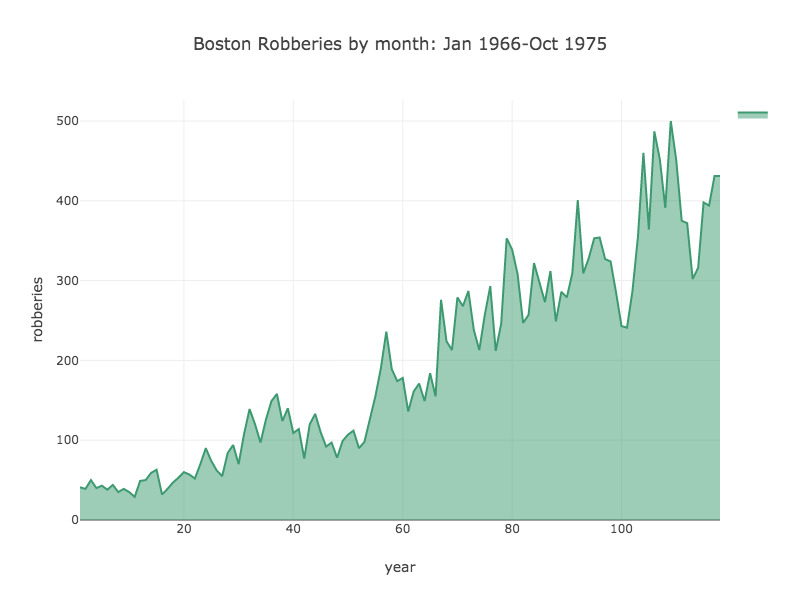
Plotting and Visualization
Tablesaw supports data visualization by providing a wrapper for the Plot.ly JavaScript plotting library. Here are a few examples of the new library in action.
 |  |  |
|---|---|---|
 |  |  |
 |  |  |
 |  |  |
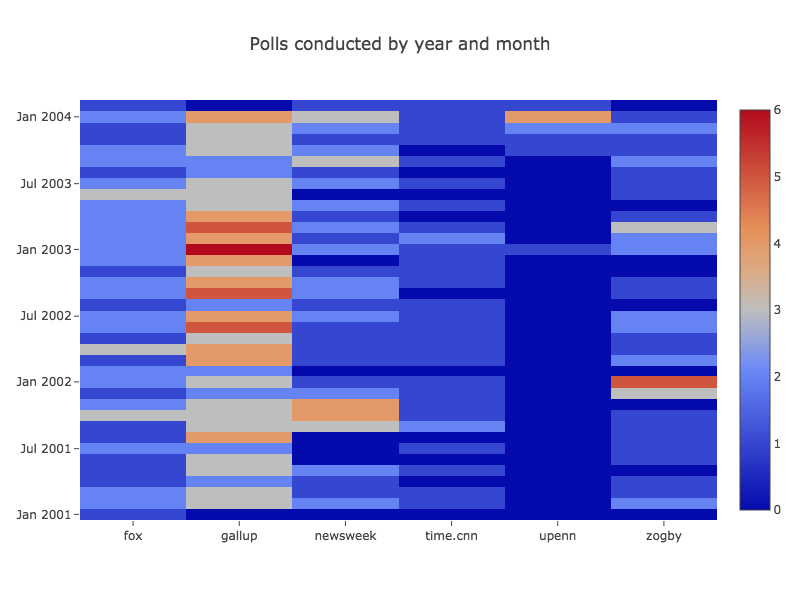 | 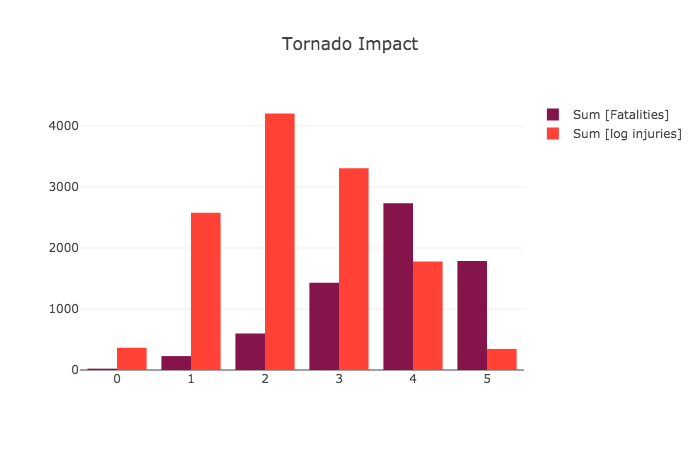 | 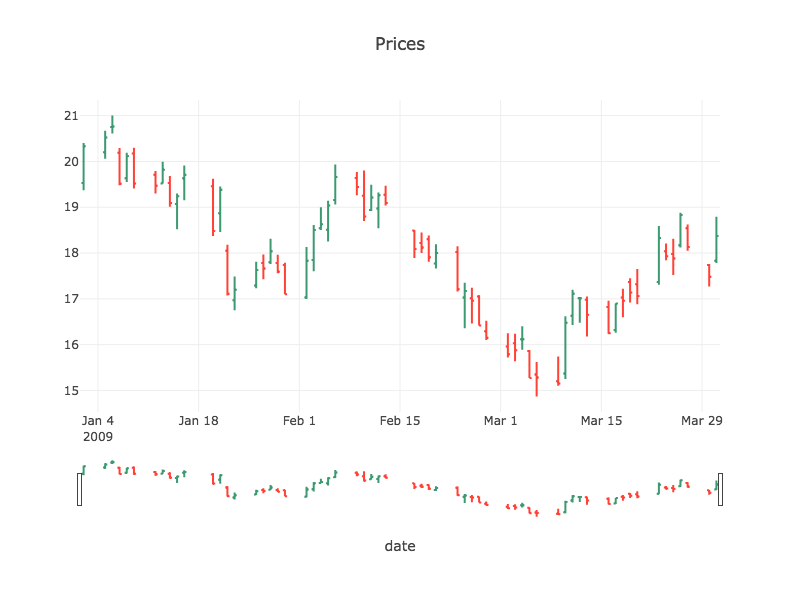 |
The plot() method integrates with the JSPlot library to generate visualizations like histograms, scatter plots, and bar charts.
1table.plot().histogram("age", 50);
Plots can be customized, saved to files, and displayed in Swing/JavaFX windows.
Input/Output
Tablesaw supports reading and writing various file formats:
- CSV, TSV
- Excel (XLSX)
- HTML tables
- JSON
- Databases via JDBC
And exporting to formats like PDF, Markdown, and Excel.
1Table table = Table.read().csv("data.csv");
2
3table.write().csv("output.csv");
Advanced Functionality
Some more advanced capabilities of Tablesaw include:
- Handling missing data via filtering, imputation
- Multi-threaded parallel processing for large datasets
- Text analysis features like stemming, n-grams
- Time series analysis with date/time columns
- Creating subtables and sampling
Conclusion
Tablesaw provides a simple yet powerful API for analyzing and manipulating tabular data in Java. With its SQL-like syntax, support for joins and aggregations, file imports/exports, plotting integrations and more, Tablesaw is a great option for working with tabular data.
It compares favorably to other Java libraries like Apache Commons Math for statistics and math, and Spark DataFrames for distributed datasets. For small to medium sized datasets that fit in memory, Tablesaw offers a concise and easy-to-use API.
See the Tablesaw documentation to get started and the code examples for more usage details.